The CPR Indicator or Central Pivotal Range is one of the well-known indicator used by many traders in their day to day trading for Intraday, Swing Trades and even for long term investment in stocks.
Many people think that the CPR Indicator is helpful for only intraday trading, but this is not true. I know many traders who are using CPR Indicator for both intraday and swing trading. CPR is a very powerful concept that can be very beneficial to every trader if they know how to use it correctly. This article will share everything about CPR Indicator or Central Pivot Range, so let's start.
What Is CPR Indicator Or Central Pivot Range?
The CPR Indicator or Central Pivot Range is one of the most popular and versatile leading technical indicators available to traders.
The range acts as major support or resistance for every stock. You can even forecast the trend of any stock, whether it will be bullish, bearish or sideways, by looking at the width of the CPR. Isn't it amazing?
Central Pivot Range is an average price that is calculated using yesterday's trading session and applied to the current trading session. CPR can be calculated as daily, weekly, or monthly depending on your trading style.
You can use Daily CPR if you are an intraday trader. If you trade positionally, you can use Weekly or even Monthly CPR. CPR gives us a range in which the market traded the most during previous day.
This range is where the majority of selling and buying took place. Basically, CPR is the average price of yesterday's movement. CPR is a very popular leading technical indicator used by many day and swing traders.
We are well known with Pivot points, which are powerful and basic indicators in Technical analysis. Similarly, CPR or Central pivot range is made up of a pivot line surrounded by support and resistance levels.
Price action traders use different types of pivot points. One of them is the Central Pivot Range or CPR Indicator.
Also Check:
Best CPR Intraday Trading Strategy
Now that you know what CPR indicator is, I will share with you a simple but very effective CPR Intraday Trading Strategy. The strategy is very simple we will use both the concept of Narrow CPR and Virgin CPR together to take intraday trades.
In this strategy first we need to find out some Virgin CPR stocks. I have discussed what virgin CPR is later in this article. Without knowing virgin CPR you won't be able to implement this strategy.
You can manually find out the virgin CPR stocks or can take the help of this Virgin CPR scanner of chartink to save your time.
Once you have picked the stocks now log in to your kite dashboard and plot the CPR indicator with floor pivots.
I have also written how to add CPR Indicator and Floor Pivots in Zerodha kite, kindly read it once again if you face any problem to plot this on your chart.
The virgin CPR acts as a strong support and resistance, so what we will do is, we will try to take entry near the virgin CPR and put our stop loss just below the virgin CPR.
There is always high probability of reversal near the virgin CPR. So, if the price reversed you can easily capture some points. Now the question is when to take an entry and exit?
You will take an entry near the virgin CPR when there is any reversal candle forms like inverted hammer, morning or evening star and your target should always be the next floor pivot.
How To Calculate The CPR Or Central Pivot Range?
CPR is made up of three components.
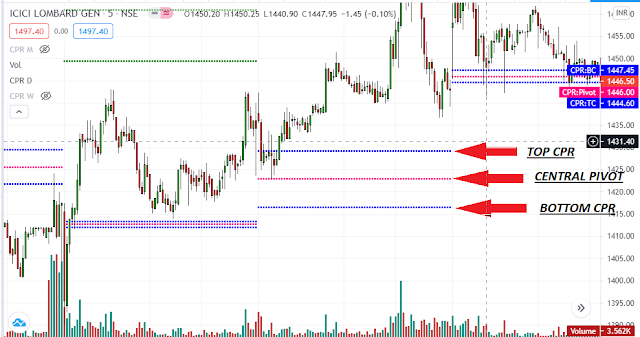
You can manually calculate the CPR of any security or stock by using the above formula. You can also use our CPR calculator to calculate the CPR along with other important floor and camarilla pivot points.
The CPR formula above clearly shows that all three levels can be calculated with just three variables: High, Low, and Closing price of any particular stock.
When CPR levels are added to a stock's charts, TC is the highest level, while the pivot is in the middle, and BC is the lowest. Depending on market conditions, TC may have a lower value than BC.
The highest value of the three values, regardless of how they are calculated, is usually referred to as TC, and BC is the lowest.
This CPR indicator's basic idea is that the trading range for a particular day captures all market sentiment and can therefore be used to predict price movements of the next days.
CPR levels are calculated using the previous day's close, high, and low prices. These levels are constant throughout the day.
How To Identify Trend Of Stocks Using CPR?
When the CPR makes higher highs every day, i.e., the CPR is one above the other, that indicates that the particular stock or security is in an uptrend.
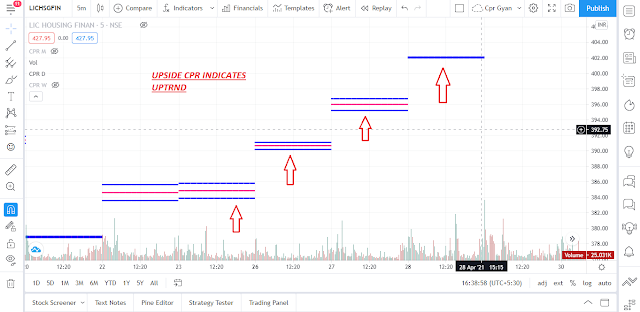
Look at the chart as you can see that the daily CPR is one above the other every day. Thus we can consider the stock is in an uptrend. When a stock is in uptrend, we should always look for buying opportunities only.
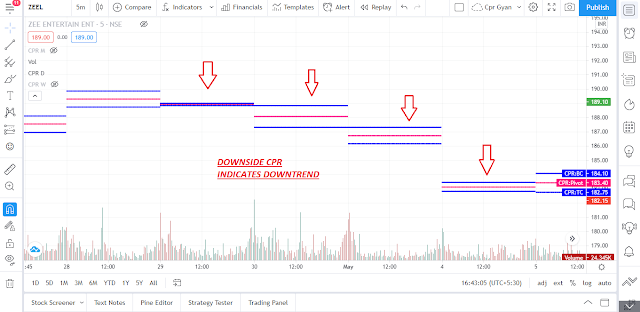
So, what about a downtrend? I think you have already guessed it. Look at the chart below. When the CPR makes lower lows every day, i.e., one CPR below the other, that indicates that the stock or security is in a downtrend.
When a stock is in downtrend, you should always look for shorting opportunities. Always follow the overall trend because the trend will always be your friend.
When the CPR is moving up and down, i.e., one day it is up, and the next day it is down, that means the stock is in a sideways trend.
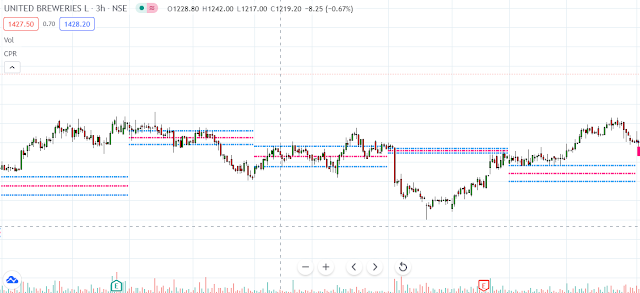
Look at the chart above as you can see that the CPRs are moving ups and downs, so we can not identify a proper trend in this stock; thus, we can consider the stock is in a sideways trend.
If you are a beginner, you should avoid trading in sideways stocks as there is high probability of stop-loss hunting in these stocks.
What Does The Width of CPR Or Central Pivot Range Indicates?
The width of the CPR Indicator or Central Pivot Range plays an important role in trading.
Analysing the width of CPR, you can easily predict the trend of any security or stock. We can divide the width of CPR broadly into three categories.
- Narrow Range CPR
- Medium Range CPR
- Wide Range CPR
Narrow Range CPR: When the width of the Central Pivot Range is narrow, it means that the stock was within a small range in the previous day, week or month, depending on the CPR you are using.
Let's assume that you are using a daily CPR and the stock was in a small range the previous day, so you will notice that today's CPR will be extremely narrow.
Thus, we can say that whenever we see a narrow CPR, there is a good possibility of a trending day.
Also read: Best CPR Trading Books
Medium Range CPR: When the CPR has a medium range, that is, the range is neither too narrow nor too wide, we can consider the CPR as a Medium range CPR.
A medium-range CPR indicates that the security or stock will not be as trending as a narrow range.
Wide Range CPR: When the range of the CPR is very wide, it means that the stock was within a big range in the previous day, i.e. the stock was trending in the previous day, assuming you are using daily CPR.
When any stock was trending in the previous day, today's CPR will mostly be a wide range CPR. Thus we can say that whenever we see a wide range of CPR, that indicates a high possibility of a sideways day.
What Is A Virgin CPR?
A CPR is called a Virgin CPR when all the candles on that trading session have closed either upside or downside of the CPR, and none of the candles closed at the CPR. A Virgin CPR acts as strong support and resistance for the subsequent few trading sessions.
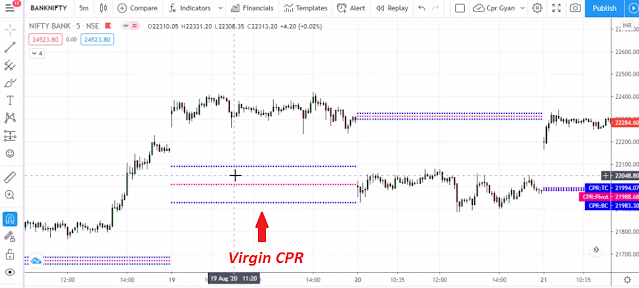
Look at the chart above as you can see that all the candles on that particular day closed above the CPR and no candle closed at the CPR; thus, we can consider it as a Virgin CPR
What Is The Use Or Benefit Of A Virgin CPR?
A Virgin CPR act as strong support or resistance. Whenever you see a virgin CPR on a stock or instrument, you first mark it for the upcoming sessions. When the price comes to that Virgin CPR level, you will probably see a strong reversal
Watch This Video To Know More About Virgin CPR:
Difference Between CPR And Pivot Points:
The CPR or Central Pivot Range comprises three pivots namely Top CPR (TC), Central Pivot and Bottom CPR (BC). All these three pivots together form the range that we call the Central Pivot Range.
Whereas in traditional pivot points these TC and BC pivots don't exist, it only comprises the Central Pivot and other floor pivots like R1,R2,R3 and S1,S2,S3 etc.
Both the CPR and Pivots points are mostly the same, the only difference is the TC and BC pivots that have been introduced by Frank Ochoa.
Also, if you want to know more about CPR strategies and How to use them for Swing Trading you can buy my Advanced Swing Trading Course Based on CPR and Price Action at just Rs 499.
Some FAQs Regarding CPR Or Central Pivot Range:
What is a CPR Indicator?
The CPR Indicator is one of the well-known indicator used by many traders in their day to day trading for Intraday, Swing Trades and even for long term investment in stocks.
What is Central Pivot Range?
Central Pivot Range is an average price that is calculated using yesterday's trading session and applied to the current trading session. CPR can be calculated as daily, weekly, or monthly depending on your trading style.
Is central pivot range effective?
Yes, It is very effective if you use Central Pivot Range with Floor and Camarilla Pivots. I have been using Central Pivot Range for the last few years and I am very happy with it.
Is CPR a good indicator?
CPR is a leading indicator that means it remains the same through out the day like other floor and camarilla pivots. Thus it provides more value and effective results than all other lagging indicators.

![The Best CPR Trading Books For Beginners [2024] cpr trading books](https://cprgyan.com/wp-content/uploads/2021/12/cpr-trading-books-300x169.jpg)

![How To Add CPR Indicator in Fyers? [Step by step] how to add cpr indicator in fyers](https://cprgyan.com/wp-content/uploads/2022/01/how-to-add-cpr-indicator-in-fyers-300x169.jpg)

Can we use this strategy for options buying (nifty and banknifty ) ? Can we use heikan ashi candle ?
Yes, you can use this strategy on nifty and banknifty.